Another Risk OFF Signal

Discretionary vs Staples Rotation
While preparing for my show Sector Spotlight this week and trying to put things together in a meaningful fashion, I also remembered to look at the XLY:XLP ratio.
When you look at the positioning of the various sectors that are likely to outperform during the various stages of the economic cycle, you can see that Consumer Discretionary is positioned at the start of a bull market cycle in stocks while Consumer Staples is positioned on the opposite side just after a peak in stocks and the start of a bear market cycle.
Looking at the ratio of these two sectors can therefore help us to determine whether the market is more likely to be in a risk ON or risk OFF mode.
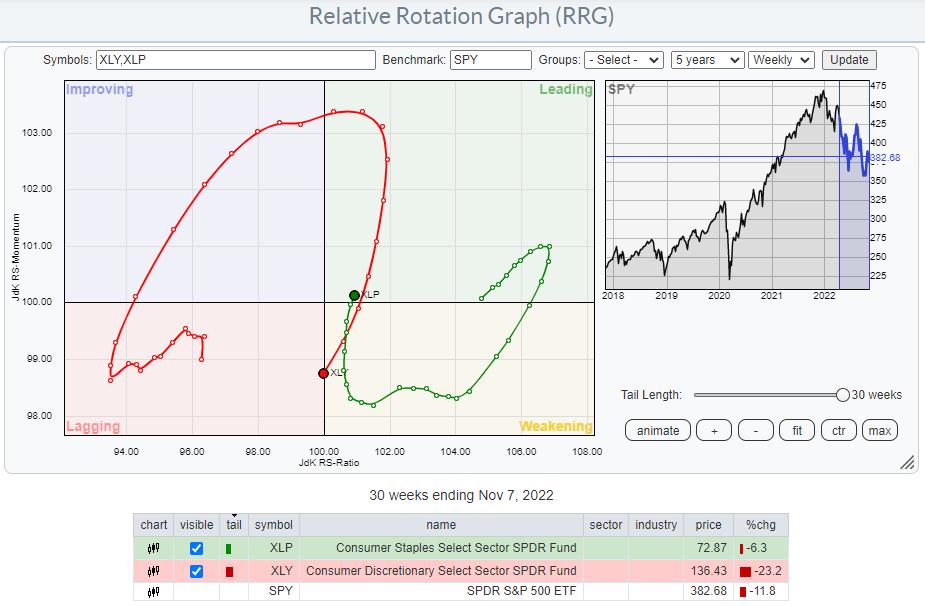
The Relative Rotation Graph at the top of this article shows the rotations for both XLY and XLP over the last 30 weeks. The generally opposite rotations are very well visible. The most interesting observation is that XLP remained at the right-hand side of the graph, rotating from leading into weakening and then back into leading. XLY managed to get into the leading quadrant from improving but almost immediately started to lose relative momentum and roll over, moving back into the lagging quadrant.
XLY:XLP Breaking Below Major Support
Last week, both tails crossed over on the RS-Ratio scale, signaling the continuation of the trend that already is in play since the start of the year.
A 1-1 comparison of XLY vs. XLP shows that the recent weakness actually also managed to break the major rising support line to be broken downward, ending the uptrend that was in play since the start of 2009.
The ratio is currently running into a support zone between 1.8-1,9, coming from peaks formed in 2004, 2014, and 2016. But even when the market manages to hold these levels, it seems very unlikely we will see a swift turnaround back in favor of Consumer Discretionary stocks.
Impact On S&P 500 Index (SPY)
For the time being, the S&P 500 is holding up above support near 360. However, the series of lower highs and lower lows, and thus the downtrend, is still very much in place. Within this framework, SPY could reach as high as the double resistance, which comes in at around 410, where the previous high level intersects with the falling resistance line.
It is tempting to jump on a train close to support levels, but it can hurt when the next higher time frame is ignored. The problem in the current situation is that the "ease of movement" is to the downside. It takes very little for the market to drop rapidly, while it can only crawl up at a very slow pace.
Given the position of the market as suggested by the sector rotation model and the risk-off signals by some important big-picture macroeconomic indicators and ratios, I still prefer to remain very cautious with allocations to stocks in general.#StaySafe, --Julius


