Everything Has Changed – And It’s For The Better!

The stock market has been like a volcano, simply waiting to erupt. The hawkish Fed and stubbornly-high inflation have wreaked havoc on stocks in 2022, but market participants have been awaiting good news on the interest rate front and I believe they got it on Thursday. The October CPI was released and the core rate of inflation at the consumer level jumped, but only by 0.3%. The expectation was for a 0.5% spike. The idea behind a surge higher in the stock market is the belief that inflation has peaked or will peak in the near-future. That would allow the Fed to hit the brakes on rate hikes and begin to address economic concerns, which would mean LOWER rates ahead, not higher. Falling rates would significantly increase valuations of growth stocks and we saw what that might look like on Thursday and Friday, as many growth stocks absolutely soared.
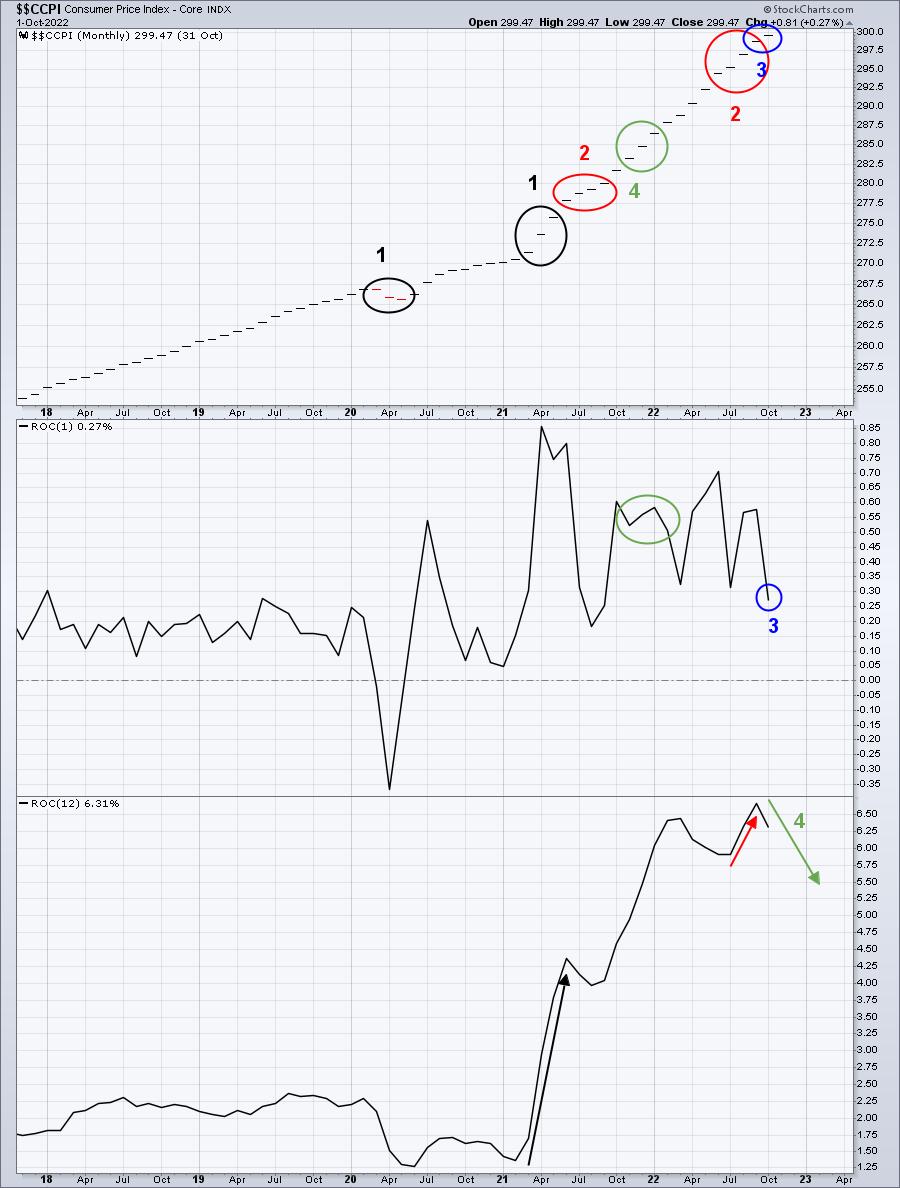
Forecasting the annual rate of inflation isn't nearly as daunting as it may appear. Here at StockCharts.com, we can track the Core CPI ($$CCPI), both on a monthly and annual basis, with a simple chart:
If you'd like to set up a similar chart, here are the key chart attributes and indicators:
I've highlighted several important parts of this chart, so let me explain them. Point 1 (black) shows that Core CPI fell during 3 consecutive months after the pandemic began - March, April, and May 2021 Core CPI report dates (published in following month). Falling CPI is extremely rare, especially doing so in 3 consecutive months. A year later, as demand began to accelerate (opening of economy), supply chain issues (supply slow to catch up) aided a surge in Core CPI on both a monthly and annual basis. When the annual Core CPI was calculated in 2021, it "threw out" those negative Core CPI readings from 2020 and replaced them with MUCH higher readings in the same months in 2021. That resulted in the HUGE spike in the annual Core CPI rate (black directional line in bottom panel).
The red circle (Point 2) highlights the slowing of monthly Core CPI numbers in July, August, and September 2021. That contributed mightily to the surge in inflation (red directional line in bottom panel) again in 2022 as those same months - July, August, and September - saw a big spike in monthly Core CPI. When you replace moderate increases with much bigger increases, the annual inflation rate will jump. That's exactly what happened and when those reports surfaced in the months subsequent (August, September, and October), interest rates soared along with that big spike in inflation. Those increasing treasury yields, together with Fed Chief "More Pain Ahead" Powell, encouraged the stock market bears to dig their heels in even deeper, doubling down on Inflamageddon. Big mistake - in my opinion.
But what happened with that blue circle (Point 3)? Wait a minute! Monthly Core CPI for October rose just 0.3% (rounded), below expectations. It was the lowest monthly Core CPI reading (+0.27%) since September 2021 and the stock market exploded higher!
Point 4 (green circle) is the one that excites me, though, from a bullish stock market perspective. The Fed has already had 4 massive rate hikes with perhaps another 50-basis point hike in December on the horizon. We haven't even seen the economic impact from those rate hikes and inflation is already weakening. That next Fed meeting on December 13-14 comes right after the November CPI report is released (Tuesday, December 13th at 8:30am ET). If we look back to the monthly Core CPI numbers from a year ago, November 2021, December 2021, and January 2022 all came in between +0.5% and +0.6%. Since the crazy high readings from April, May, and June 2021, we've only had ONE (!!!!!) Core CPI reading above +0.6%. In other words, it's VERY LIKELY that our annual Core CPI rate will drop over the next 3 months. So unless we see a BIG increase in the monthly Core CPI over the next 3 months, the Fed's narrative is going to change.
If I'm right, the stock market narrative is also going to change in a big, big way, and what we saw on Thursday and Friday won't be a two-day wonder. I think we've come to the end of this inflation cycle and I think the stock market finally sees it. I've said throughout 2022 that we'd see a CYCLICAL bear market, followed by a surge higher in the stock market as interest rates drop. It's starting folks.
Now is the time to adjust your approach to the stock market in order to outperform the S&P 500. Our Model Portfolio has risen 118.95% since its inception on November 19, 2018. The S&P 500, by comparison, has risen 48.40% over the same period. In the current quarter, the S&P 500 is down 5.57% and our Model Portfolio is down 2.82%. Barring significant underperformance in the next week, our Model Portfolio will outperform the benchmark for the 10th time in the last 16 quarters. Evaluating market conditions and constructing a portfolio to outperform the benchmark is one of our strengths, as evidenced by our long-term portfolio track record.
In Monday's FREE EB Digest newsletter, I'll be discussing a very important consideration in constructing your portfolio for the next 90 days. NOW is the time to adjust, NOT after major rotation takes place and CNBC finally realizes what's happening. CLICK HERE to sign up with your name and email address. There's no credit card required and you may unsubscribe at any time.
One last thing. We've just started our Fall Special, our BEST DEAL of the year! For more information and to save money, be sure to check it out by clicking on the link!
Happy trading!
Tom


