How to Use the Relative Volatility Index While Trading?

How to Use the Relative Volatility Index While Trading?
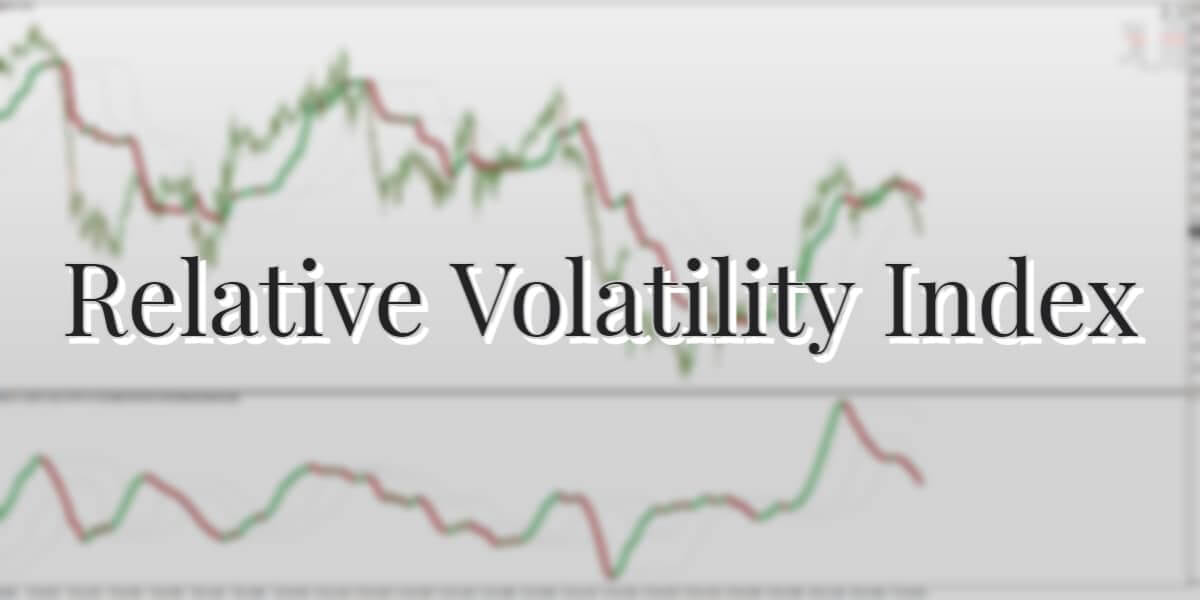
The Relative Volatility Index (RVI) is a technical indicator that resembles the Relative Strength Index. What’s interesting, you can consider the Relative Volatility Index as a less-known ‘brother’ of the Relative Strength Index (RSI). As a matter of fact, when applied to a chart, the RVI tends to appear like the RSI.
Do you know what the Relative Volatility Index is?
As stated earlier, the RVI resembles the RSI. Interestingly, the only difference between the RVI and RSI is that the first one is calculated using the standard deviation.
Donald Dorsey developed the Relative Volatility Index. The technical indicator mentioned above is quite popular among traders. It is with noting that the RVI isn’t included in the vast majority of platforms like the MetaTrader 4, also known as MT4. Nevertheless, it is possible to install RVI on MT4 and other platforms.
Volatility and its importance
It is worth noting that volatility refers to the overall rate of change in asset prices. For instance, if a stock remains unaltered for a month, it can be said to have low volatility. However, if a stock opens at $8, jumps to $14, declines below $6, and then rises to $13 in a single session, in that case, we can talk about high volatility.
Some companies are famous for their high volatility. Moreover, cryptocurrencies are famous for being extremely volatile. The price of a specific cryptocurrency could change numerous over a short period of time.
We can now focus on the formula of the Relative Volatility Index. What’s interesting is that the above-mentioned indicator is calculated in a similar fashion that the RSI is calculated. Nevertheless, the difference is that, as mentioned above, the RVI utilized the standard deviation.
In order to calculate the standard deviation, you first need to calculate the average. Don’t worry; you will get used to the technical aspects.
Do you know how to add RVI to a chart?
Remember, the RVI is a line that goes up and down. When adding the above-mentioned technical indicator to a chart, you have to pick the RVI and pick the settings that you want. It is only possible to modify the color of the indicator, the length, as well, as the overbought and oversold levels.
How to read and trade with Relative Volatility Index
Do you know how to interpret the above-mentioned technical indicator? When RVI is applied, the value of RVI moves from zero to 100. It is important to note that the main lines to watch are 20 and 80.
The conventional approach utilizes the 20 and 80 as the oversold and overbought levels, respectively.
Relative Strength Index
Let’s take a look at the Relative Strength Index. Without exaggeration, it is one of the most popular technical indicators. Furthermore, technical analysis is one of the widely used trading methods in the market.
As opposed to fundamental analysis, technical analysis utilizes technical indicators in order to predict the future direction of an asset.
There is no shortage of indicators. Interestingly, the vast majority of indicators were developed a long time ago. However, traders are still using them. As stated earlier, the RSI is one of the most widely used technical indicators.
Welles Wilder developed the Relative Strength Index in the 1950s. He has developed other indicators as well.
The Relative Strength Index is a momentum indicator that measures the speed as well as the change in price movements.
The RSI is an oscillator that moves from zero to 100.
Relative Strength Index vs. Relative Volatility Index
As in the case of the RSI, it is possible to use the RVI in order to locate divergence in an asset.
Divergence occurs when an asset’s price is going up while the technical indicator is moving in the opposite direction. When it occurs, it is usually a signal that the price is about to reverse.
It is also possible to utilize the RVI in combination with other indicators.
In conclusion, the Relative Volatility Index isn’t a popular indicator in the financial market. In fact, the RVI isn’t provided as prebuilt in the vast majority of platforms like MT4 and MT5.
Furthermore, it often provides the wrong signals. So, you need to be very careful when it comes to Relative Volatility Index.
The post How to Use the Relative Volatility Index While Trading? appeared first on FinanceBrokerage.


