The Ord Oracle October 3, 2023

SPX Monitoring Purposes: Long SPX 9/28/23 at 4299.70.
Gain since 12/20/22: 15.93%.
Monitoring Purposes GOLD: Long GDX on 10/9/20 at 40.78.
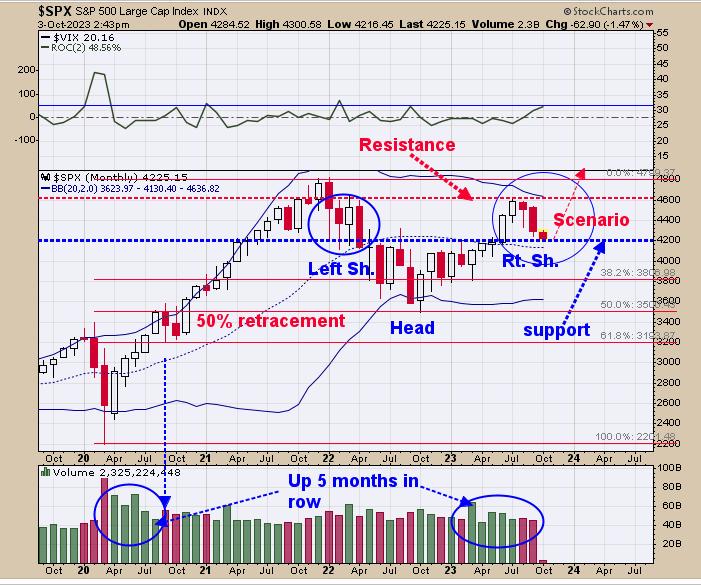
Above is the monthly SPX. The pattern that appears to be forming is a head-and-shoulders bottom. Support lies near the 4200 range, which is being tested. The "Right Shoulder" appears to be in the making and, once completed, another rally may start that leads to new highs. The SPX was up 5 months in a row going into July, which in the past has not marked the final high. At a minimum, after a 5-month rally, the market will see at least one new higher high (momentum rules). Long SPX 9/28/23 at 4299.70.
The bottom window is the NYSE Advancing Issues/NYSE Total Issues with a 10-period average. A "Zweig Breadth Thrust" occurs when this indicator drops below .40 than rallies to .60 within 10 days. We pointed out the previous "Zweig Breadth Thrust" in the past. The current reading on this indicator stands at .35, and we would like to see a thrust to .60 in the next 10 days, as this condition would trigger a "Zweig Breadth Thrust" and a bullish sign for a rally into year-end. Previous examples of readings below .40 on chart above have led to short-term lows in the past. Also notice that SPX is near the 4200 support area. SPX appears to be near a low.
Tim Ord,
Editor
www.ord-oracle.com. Book release "The Secret Science of Price and Volume" by Timothy Ord, buy at www.Amazon.com.
Signals are provided as general information only and are not investment recommendations. You are responsible for your own investment decisions. Past performance does not guarantee future performance. Opinions are based on historical research and data believed reliable; there is no guarantee results will be profitable. Not responsible for errors or omissions. I may invest in the vehicles mentioned above.


