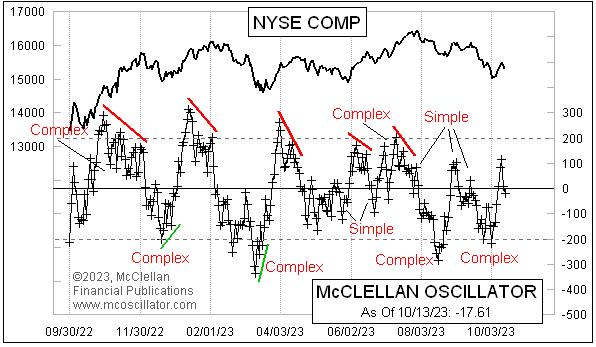
McClellan Oscillator Leaves a Simple Structure Above Zero

As we are looking for when the normal seasonal low is going to arrive, what we want to see is either a juicy oversold condition that one can buy into or a confirmation of a new uptrend getting started. Or both. We did not get as juicy of an oversold condition as I would have liked, but the stock market started up anyway, and even took the NYSE's McClellan A-D Oscillator up above its zero neutral level.
Now, however, the Oscillator has fallen back down through zero as of Friday, Oct. 13, 2023, and the manner of this brief trip above zero has additional information for us to learn from.
At an elementary level, the Oscillator is bullish when it is above zero and bearish when below zero. And it can get to overbought and oversold extremes. At the next level of learning, we find that there is additional information available from the patterns that the Oscillator forms. And the simplest of these is to evaluate whether there is a "simple" or "complex" structure.
A complex structure is one that involves chopping up and down on one side of the zero line without crossing that line. Complex structures convey a message of strength for the side of zero on which they form. This can be bullish strength if above zero, or bearish strength if below. That message of strength remains in effect until either there is a divergence relative to prices or it gets refuted by a subsequent structure.
A simple structure sees the Oscillator move across zero and then back again, without building any complexity. A simple structure says that side is weak. Sometimes you can see alternating simple structures on both sides of zero, saying that neither side is in charge.
This latest trip above zero can now be declared to be a simple structure, now that the Oscillator has dropped back below the zero line. The message is that the initial attempt to start a bullish seasonal up move was perhaps started too early, before all the troops were in formation and ready to march. Seeing the structure above zero as a simple one does not necessarily mean that the bears are in control; it just means that the bulls are not, and the bears have a chance now to try their hand.
If we see the Oscillator jump back up above zero again soon, that would mean this dip below zero is a simple one, which cancels the message of the prior complex structure below zero. And that would be a moment to say that the bulls have a chance once again to see if they can get something started.
You can see a chart of the NYSE's McClellan A-D Oscillator every day on our web site's Market Breadth Data page. And if you want to learn more about what the Oscillator's patterns can tell us, check out Sherman and Marian McClellan's original book, Patterns For Profit, available in electronic form here.


