Sentiment Lopsided – Is It a Problem?

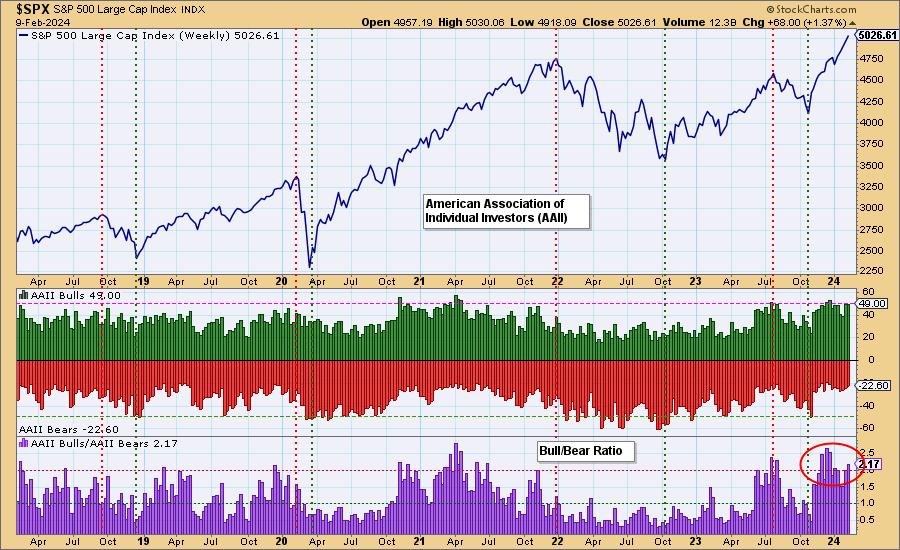
Periodically, we like to review sentiment charts, and today we have two for you. One is the poll results from the American Association of Individual Investors (AAII) and the other is the National Association of Active Investment Managers (NAAIM) Exposure level.
In both cases, we are starting to see sentiment lopsided to the bullish side. Not a surprise; given the rally out of the October lows, investors should be bullish. However, bullish sentiment becomes a problem if it hits extremes. Sentiment is contrarian. When investors get overly bullish and hop on the wagon, the wheels will eventually fall off from the weight. The reverse is also true with extreme bearish sentiment typically leading to higher prices. This is apparent when you look at key tops and bottoms in the market.
The Bull/Bear Ratio is where to focus on the AAII chart. The ratio is definitely showing strain to the upside, but it could get more overbought.
The NAAIM Exposure Index shows high readings of exposure. We would point out that during a strong bull market move, as we saw in 2020-2021, those readings can get very overbought and not lead to downside. We just note that last time readings got to this level, it was a problem.
Conclusion: Readings on sentiment indicators are lopsided to the bullish side. However, we do note that these readings can persist in a strong bull market move. That is likely the case right now, but we should be aware that current conditions are reading overbought for sentiment indicators. It will be worth watching further.
Watch the latest episode of the DecisionPointTrading Room on DP's YouTube channel here!
Try us out for two weeks with a trial subscription!
Use coupon code: DPTRIAL2 at checkout!
Technical Analysis is a windsock, not a crystal ball. --Carl Swenlin(c) Copyright 2024 DecisionPoint.com
Disclaimer: This blog is for educational purposes only and should not be construed as financial advice. The ideas and strategies should never be used without first assessing your own personal and financial situation, or without consulting a financial professional. Any opinions expressed herein are solely those of the author, and do not in any way represent the views or opinions of any other person or entity.
DecisionPoint is not a registered investment advisor. Investment and trading decisions are solely your responsibility. DecisionPoint newsletters, blogs or website materials should NOT be interpreted as a recommendation or solicitation to buy or sell any security or to take any specific action.
Helpful DecisionPoint Links:
Price Momentum Oscillator (PMO)


