Some Bull Market Sectors Are Forming

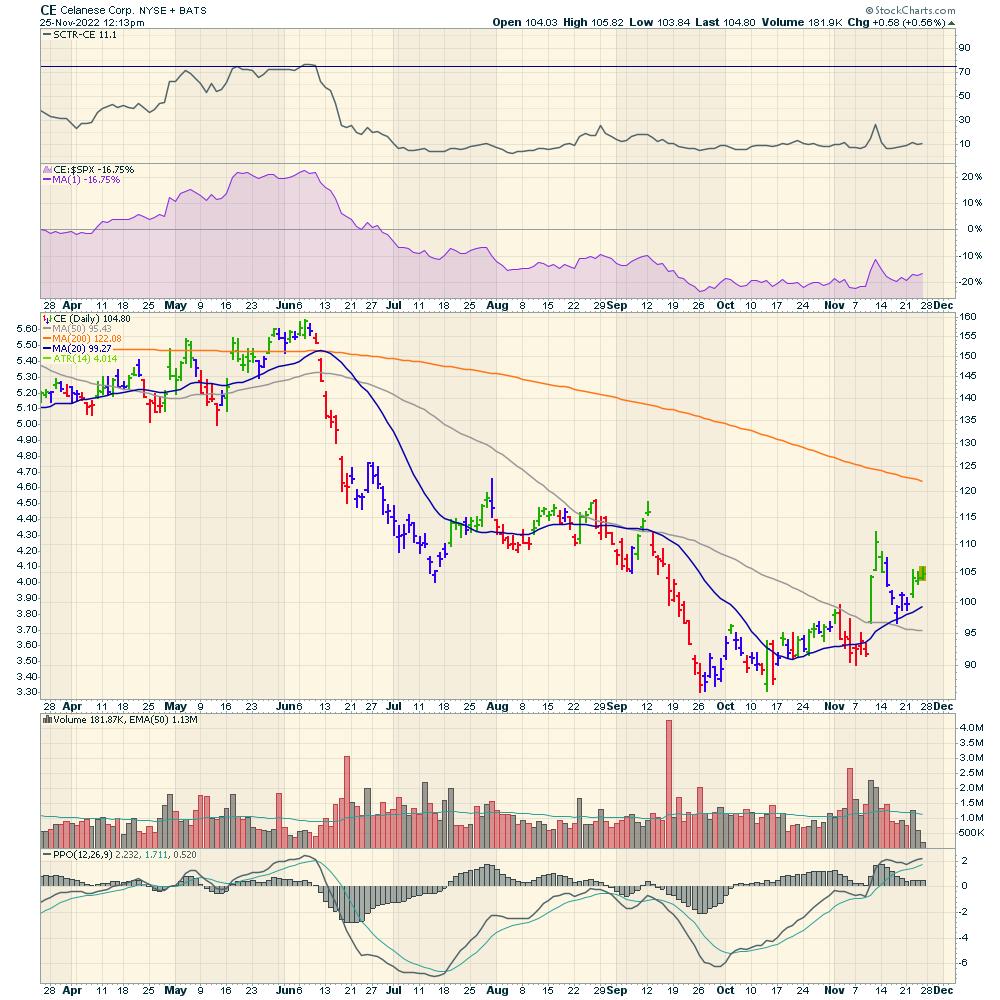
As the market changes from bear to bull, there should be a market rotation away from defensives. While defensives and financials are still performing well, Industrials are also leading the way. It might not have the charm of something the younger generation has been yelling about, but I just heard that Warren Buffet and Charlie Munger were buying Celanese shares in chunks. This chart is not the shape for technicians, but it is the shape for value buyers starting to push the price up.
So what chart shapes do technicians like? One entry style I like is breakouts above trend lines, or stocks making new 3-month, 6-month or 1-year highs. I created a scan to find stocks that made a new high anytime this month (November 2022) and there were 312. That is very positive considering how the market indexes are well below the highs.
An example of a nice chart for me is CN Rail in a strong sector.
Some reasons I like the chart are the SCTR is breaking above 75. The purple area shows the stock outperforming the S&P 500. The stock is trying to break out to new six-month highs. One for the watch list.
As the market changes complexion, it can be really profitable to find new market leaders. I will be hosting an information session on Tuesday, November 29th about the work we do at Osprey Strategic and how we approach the market. Live attendees will have an opportunity to win a 'StockCharts for Dummies' book!
As well, any new clients are welcome to join in and listen to the monthly client conference call on Wednesday November 30th at 5 PM ET. We'll share some of the stock ideas we like and why the market is so mixed. We like to make money when the backdrop is positive and we'll talk about how we do that on Tuesday.


