Finding the Leaders after a Sharp Decline – with Video (Free)

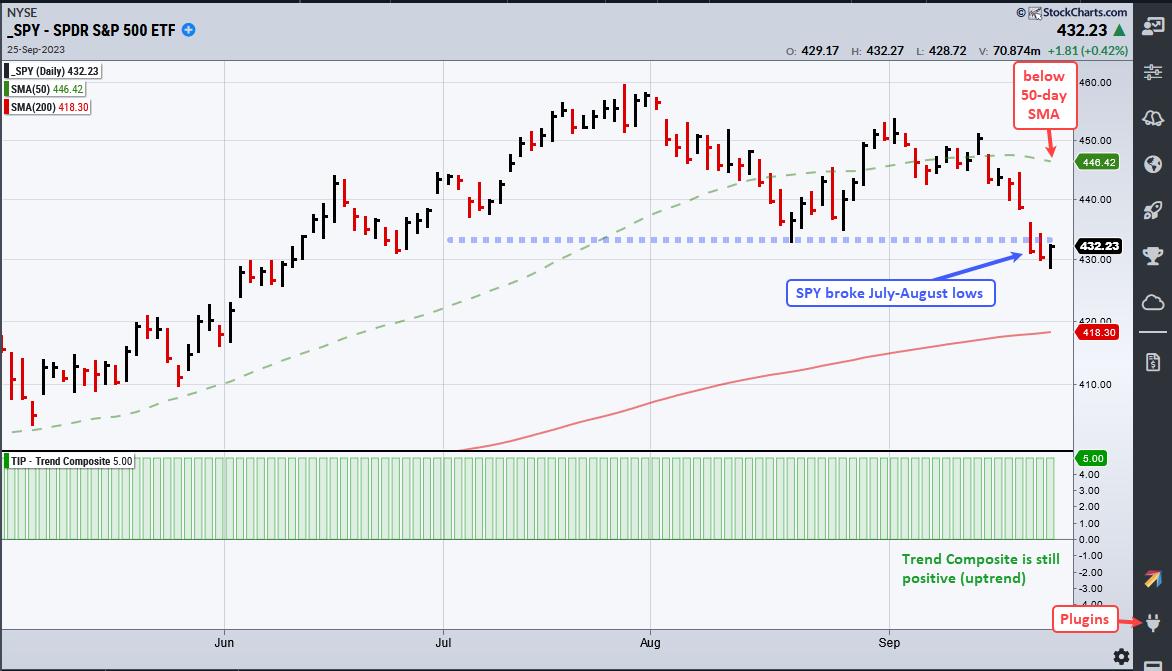
Stocks fell sharply in September with the S&P 500 SPDR (SPY) breaking below its August low. Chartists can now use this low as a benchmark low to gauge relative performance. Stocks that held above the August low are showing relative strength. This is valuable information because stocks that hold up better during declines have a better chance of moving higher. Let's look at an example.
Finding the Leaders after a Sharp Decline The first chart shows SPY breaking below its August low with the decline to around 430. The ETF is also well below its 50-day SMA (green dashed line). Keep these characteristics in mind when analyzing the next chart.
The next chart shows Paccar (PCAR) hitting a new high in July and moving sideways the last few months. Instead of falling in September, PCAR edged higher and did not break the July-August lows. PCAR also closed above its 50-day SMA on Monday. Clearly, PCAR is holding up better than SPY and showing relative strength. We used these techniques to identify five Nasdaq 100 stocks holding up well in September.
As far as chart patterns are concerned, PCAR hit a new high in July and then consolidated into August. I view this consolidation as a rest within the uptrend. Put another way, this is a bullish continuation pattern. A breakout is in the making and I expect PCAR to continue higher.
Tuesday's Chart Trader Report and Video featured PCAR and five other stocks. These stocks have similar characteristics: long-term uptrends, bullish consolidations and relative strength. Click here to learn more and gain immediate access.
//////////////////////////////////////////////////


